Government Action Carbon Pricing Technological Innovation Capital Markets Pressure Consumer Pressure Learn More
Left arrow button
Right arrow button

Carbonomics

The Economics of Net Zero

To meet the Paris Agreement goal of keeping global temperatures well below 2°C, a growing number of countries, cities, and companies are aiming to reach Net Zero by 2050. But how can we achieve it? How much will it cost? And what's driving the trillions of dollars in investments required to reach it? Goldman Sachs Research identifies five themes that will shape progress towards Net Zero.

Government Action

National commitments to Net Zero and further cuts to carbon emissions by 2030 are at the core of inter-governmental discussions and central to reaching Net Zero quickly.

Here are two paths to achieving global Net Zero in the next four decades. The first path aims to keep global warming below 1.5°C and reach Net Zero by 2050, but would require a complete overhaul of all emitting industries.

Carbon Pricing

Carbon pricing will encourage polluters to cut their emissions and to invest in low-carbon alternatives.

Our de-carbonization cost curve shows the path to Net Zero for key carbon-emitting sectors. The speed of de-carbonization in each carbon-emitting sector largely depends on the current carbon abatement cost and how ready clean technologies are in that industry.

De-carbonization is cheaper in power generation, a sector where costs have fallen rapidly over the past decade, as well as in agriculture, where better crop management practices can reduce emissions.

A carbon price of $43 per ton of CO2 would incentivize the removal of 50% of carbon emissions from the global economy.

As we go up the cost curve, it becomes increasingly expensive to remove carbon emissions from sectors such as heavy industry and transportation including aviation, shipping, and rural road transport.

At the far end of the cost curve sit the carbon emissions that cannot be abated at any reasonable cost with current technology. These emissions represent about 15% of total anthropogenic emissions.

Our de-carbonization cost curve shows that higher carbon prices will be needed to achieve Net Zero. To get polluters to adapt, it must become more expensive to generate greenhouse gases than to invest in new solutions.

Power Generation
Transport
Industry
Buildings
Agriculture
Non-Abatable with Current Technology
Technological Innovation

Our de-carbonization cost curve has flattened for three consecutive years, partly due to investments in clean technology.

Half of global emissions can be abated at around $1.1 trillion a year, compared with $1.2 trillion a year based on our 2020 cost curve.

There are bigger savings when we consider de-carbonizing more of the global economy. We estimate around a 13% annual cost reduction between 2020 and 2021 to remove 75% of anthropogenic carbon emissions.

We expect the cost curve to continue to fall, driven by technological innovation and the benefits of scale.

2019
2020
2021

Technological Innovation

Clean hydrogen could provide de-carbonization solutions in the most challenging parts of the cost curve, including long-haul transport, steel, chemicals, heating, and long-term power storage.

Around 15% of global CO2 emissions could be abated through technologies that rely on clean hydrogen.

Clean hydrogen
Other technologies
Non abateable with current technologies

Technological Innovation

Carbon capture technologies will be necessary to offset the emissions from economic activity where it’s not possible to abate carbon at any reasonable cost.

Direct Air Carbon Capture and Storage (DACCS) is a wildcard technology that could unlock almost infinitely scalable de-carbonization.

We estimate that DACCS and natural sinks will be responsible for removing 15% of emissions from harder-to-abate sectors by 2050.

DACCS abatement
Natural sinks abatement
DACCS and natural sinks contribution as a % of hard-to-abate C02 emissions

Capital Markets Pressure

Investors are placing pressure on corporate management to incorporate climate change into their business plans and strategies.

More than $100 trillion global assets under management have signed up to the UN Principles for Responsible Investment and are implementing ESG metrics as part of their investment process.

These cumulative monthly flows into equity funds below show the popularity of ESG funds.

ESG Equity Funds
Non-ESG Equity Funds

Capital Markets Pressure

The difference in the cost of capital between low-carbon and carbon-intensive projects translates into an implied carbon price of $80/ton for new oil developments.

This cost of capital spread is driving a historical turning point in energy investment, with global renewable power spend overtaking oil & gas developments for the first time in history.

Offshore oil base
Offshore oil range
LNG base
LNG range

Consumer Pressure

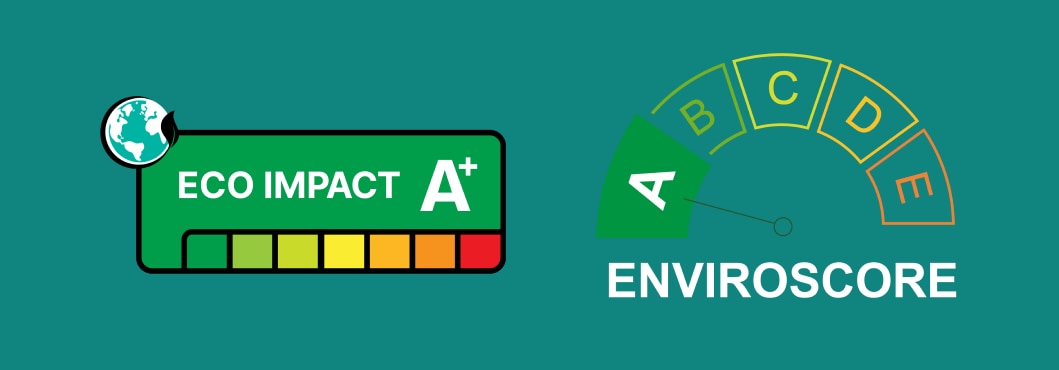
Consumers can easily find information on the nutritional content of packaged food, so that they can make informed decisions about their health. Yet there is a lack of information about a product’s environmental impact.

Carbon labeling could have a positive effect on consumer choices and the impact they have on the environment.

Carbon labeling

Carbon label
via foundation-earth.org

Learn more about the path to Net Zero